Sustainability ReportPerformance
 Social
 Governance
Environmental
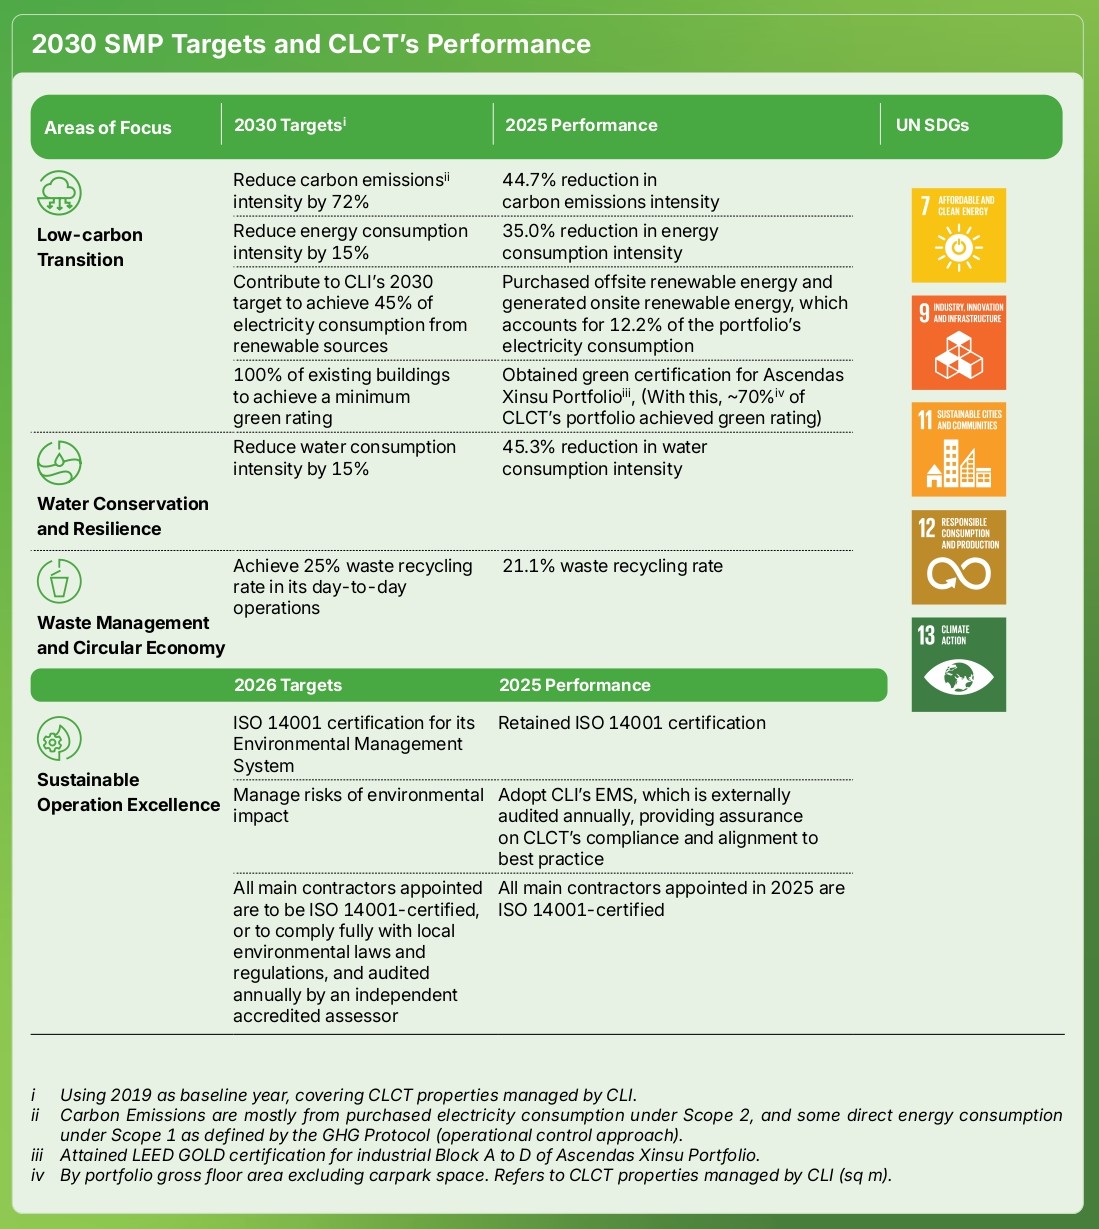
CLCT’s Environmental Targets
The 2030 SMP outlined the CLI Group’s 2030 targets and pathways to transit to a low-carbon business, improve resource use and enable a circular economy. As a CLI-sponsored REIT, CLCT has incorporated KPIs, most of which are linked to remuneration for all employees in the REIT Manager, including top management. Concurrently, we continue to actively engage stakeholders and implement various measures to achieve these targets.
Top Management Commitment and Employee Involvement
CLCT’s Sustainability Management Committee (SMC) is led by CLCT’s CEO and supported by key management team members that oversees the REIT’s sustainability objectives and strategies directly. Supporting the SMC is CLCT’s Sustainability Working Committee (SWC), which collaborates closely with CLI’s EHS Committee to implement sustainability-related initiatives across its operations.
Key Performance Indicators (KPIs) Tied to Remuneration
The remuneration for all employees in the REIT Manager, including top management, is linked to CLCT’s environmental targets through KPIs. Employees are actively encouraged to report environmental-related issues and complaints, as well as instances of non-compliances and non-conformities.
Tracking Our Environmental Results
Environmental Tracking System (ETS)
Since 2008, we have monitored the energy and water usage, waste generation and carbon emissions of our managed and owned properties through CLI’s ETS. CLCT leverages this platform to survey the various environmental initiatives implemented at its properties globally, including energy and water efficiency measures, biodiversity and habitat risks, as well as physical risks that include flood risk and water management initiatives.
The cloud-based ETS platform enables benchmarking of consumption patterns and identifies opportunities for operational efficiency improvements. It allows properties to analyse consumption against targets and past trends, make regional comparisons, and pinpoint areas for improvement. The data is also analysed against reduction targets, thereby enhancing the understanding of consumption patterns and identification of eco-efficiency opportunities in CLCT’s portfolio. Regular desktop audits are conducted to ensure data accuracy and completeness.
Climate Change Strategy
Climate change presents one of the most significant challenges of our time, with far-reaching implications for businesses, communities and ecosystems. CLI and its REITs recognise the need to take action to mitigate their environmental impact and adapt to emerging risks. CLI started to align its climate-related disclosures with the TCFD recommendations in the four key areas of governance, strategy, risk management and metrics and targets since 2017 and further declared its support for TCFD and its recommendations in 2019. With the publication of the ISSB IFRS S2 Climate-related Disclosures, CLI and its REITs, including CLCT, strive to continuously enhance their climate-related disclosures as aligned with international best practices. For more details, please refer to the SR 2025 Data Pack, where we provide the IFRS S2 index and signpost the corresponding disclosures across the SR and online sources.
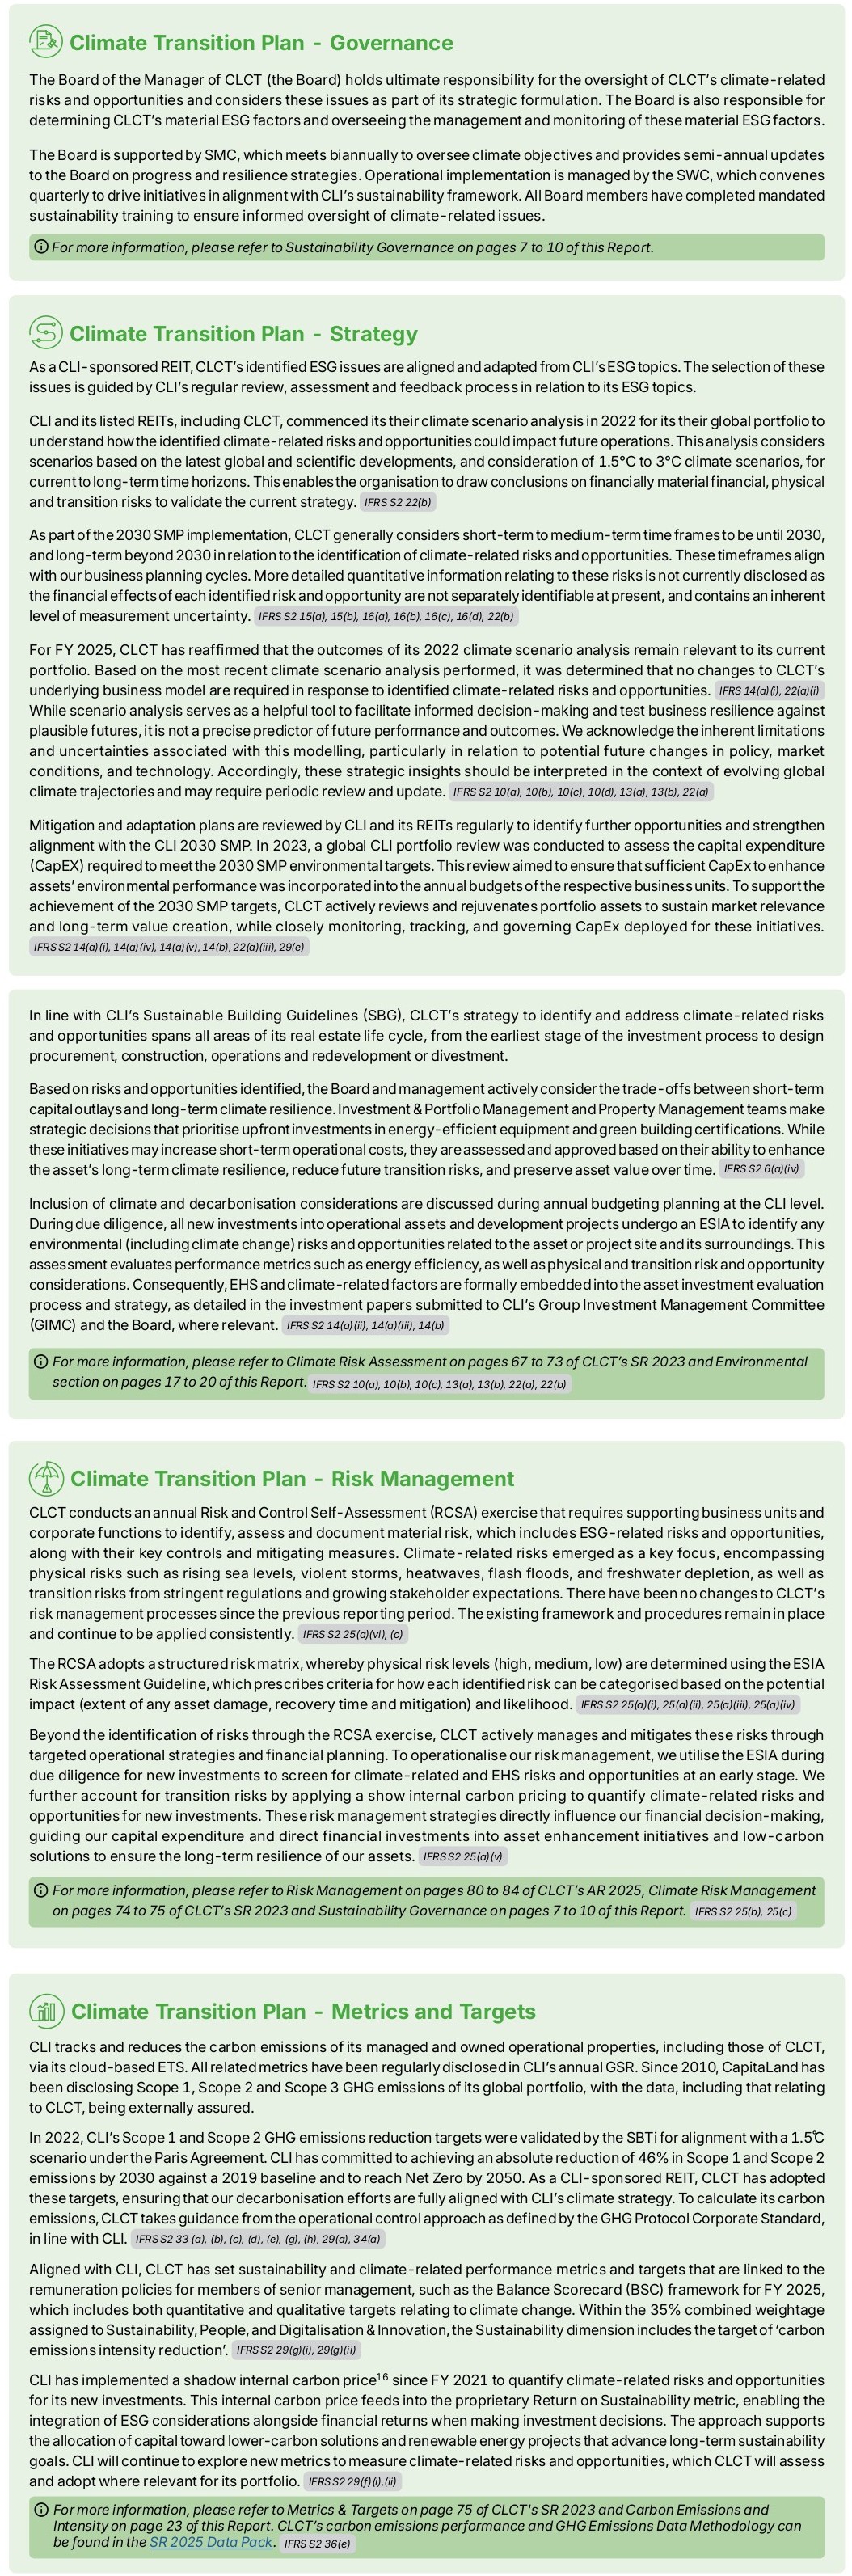
For more information on CLCT’s climate strategy and scenario analysis, please refer to pages 65 to 75 of CLCT’s ISR 2023: https://investor.clct.com.sg/misc/isr2023.pdf, which are equally applicable to CLCT in FY 2025. IFRS S2 10 (a), 10(b), 10(c), 10(d)
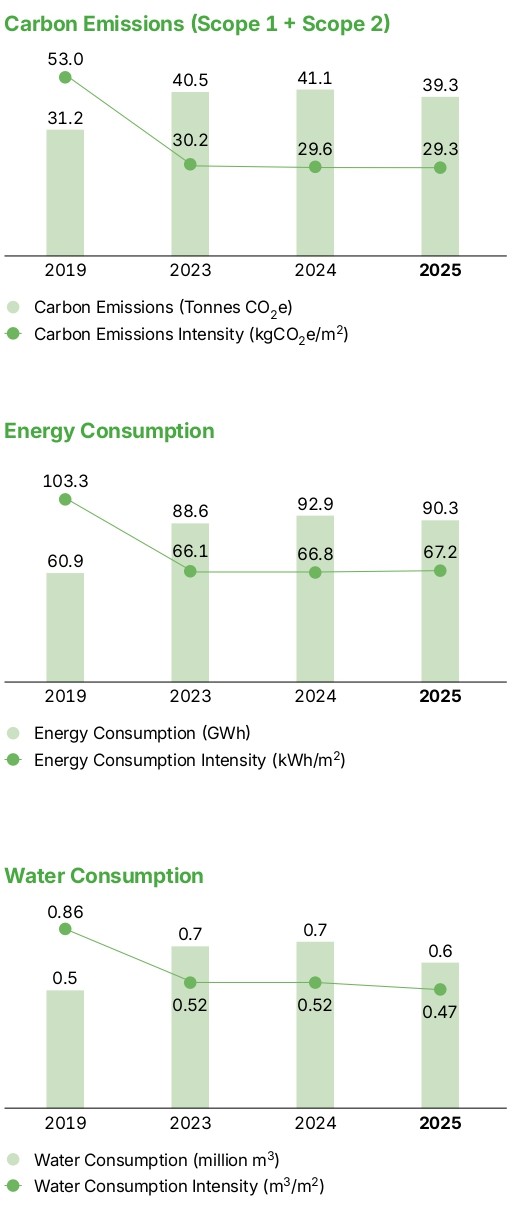
Carbon Emissions and Intensity
As a CLI-sponsored REIT, CLCT is aligned with CLI’s commitment to reduce the carbon emissions of its operations with a 1.5°C trajectory17, with an aim to achieve Net Zero Scope 1 and Scope 2 GHG emissions by 205018. In line with the CLI Group, CLCT takes guidance from the operational control approach as defined by the GHG Protocol Corporate Standard to calculate its carbon emissions. IFRS S2 33(a) – 33(h), 34(a), 36(a) – 36(d)
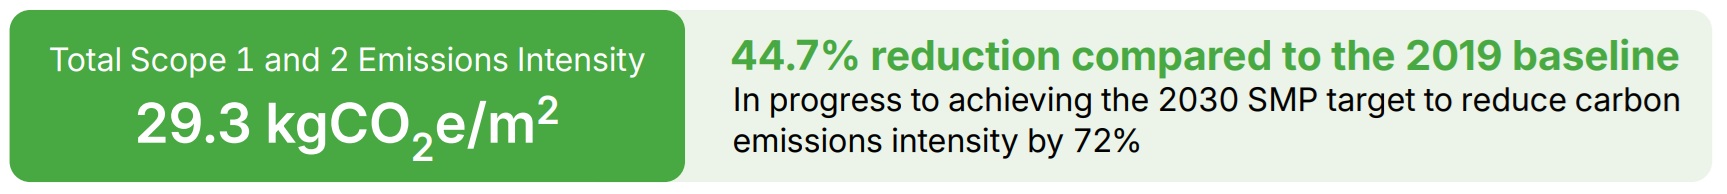
In 2025, CLCT’s Scope 1 and Scope 2 GHG emissions were 6,212 tCO2e and 33,112 tCO2e respectively, totalling 39,324 tCO2e. This translates to a carbon emissions intensity of 29.3 KgCO2e/m2, a 44.7% reduction compared to the 2019 baseline. CLCT’s total Scope 1 and Scope 2 GHG emissions intensity decreased by 1%, mainly attributed to the increase of green electricity purchased from 10.3% in 2024 to 12.2% in 2025, as a total of landlord electricity consumption. CLCT’s Scope 3 GHG emissions amounted to 116,091 tCO2e in 2025. Please refer to GHG Emissions Data Methodology in the SR 2025 Data Pack for more details. IFRS S2 29(a)(i), 29(a)(iii), 29(a)(v), 29(a)(vi), 33(c), 34(c), 35
Energy Consumption, Intensity and Renewable Energy
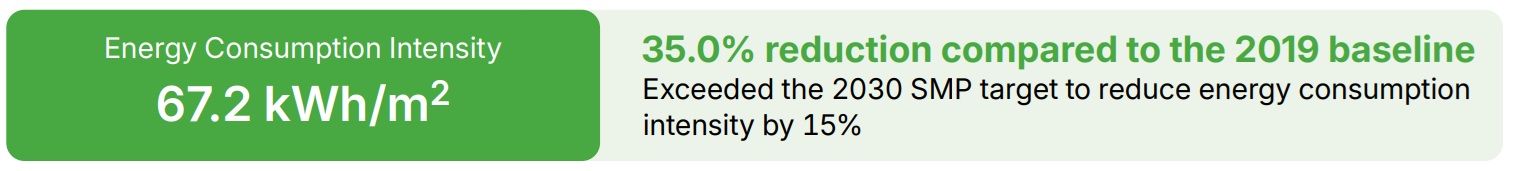
Improving energy efficiency and implementing onsite and offsite renewables are the most impactful and cost-effective ways to mitigate emissions. In 2025, the total energy consumption of operational properties was 90,304 MWh. This translates to an energy consumption intensity of 67.2 kWh/m2, a 35.0% reduction compared to the 2019 baseline. On a YoY basis, CLCT’s energy consumption intensity stayed relatively constant compared to 2024.
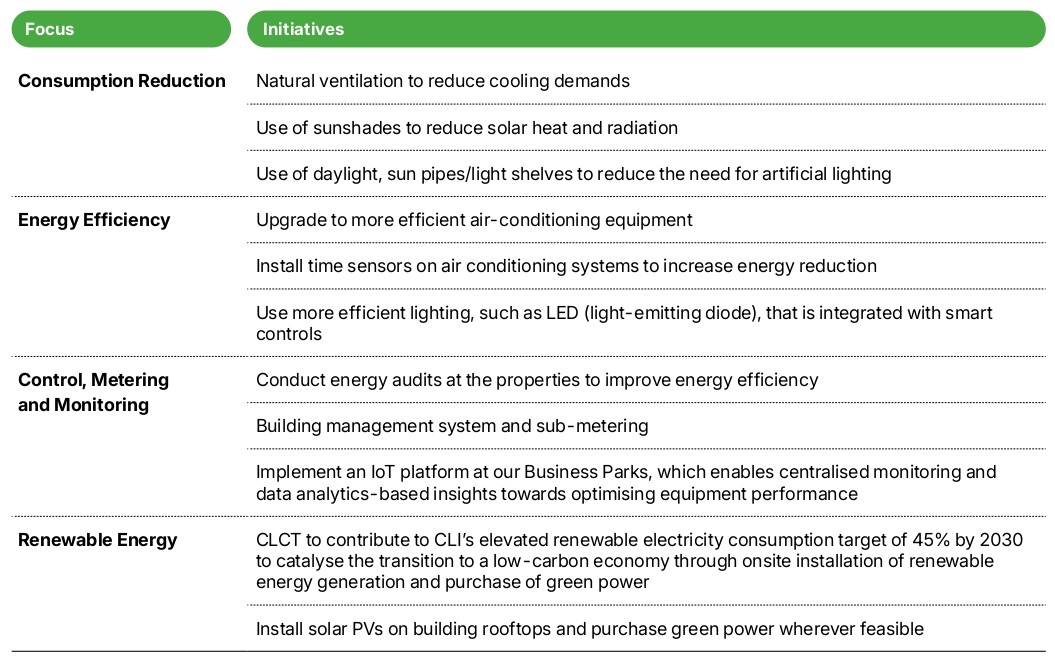
As a CLI-sponsored REIT, CLCT implements various energy conservation measures, including:
Water Consumption and Intensity
CLCT adopts a strategic approach to water management in its portfolio and is committed to reducing water consumption. A regular survey is conducted to better understand water source and discharge from each property. At all CLCT’s properties, the primary source of water withdrawal is from municipal resources and wastewater is responsibly disposed of through municipal facilities, in compliance with relevant local regulations. All water withdrawn by CLCT is assumed to be discharged. For the purposes of this report, the term “water consumption” has been used to represent the water used in CLCT’s business operations. For tenants who are discharging their own wastewater, these requirements are communicated to them via the tenancy agreements.
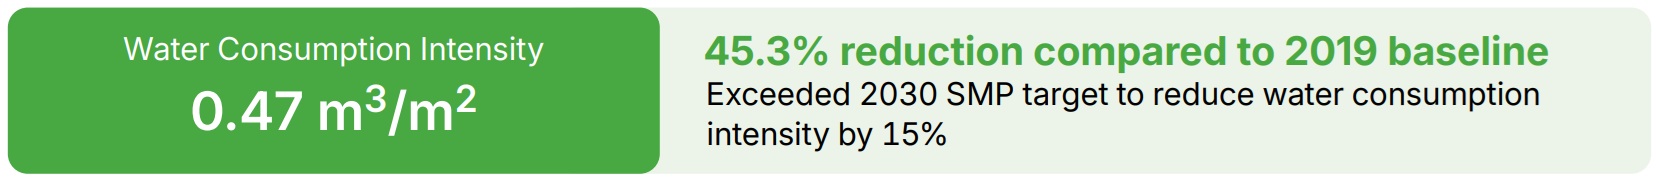
The majority of CLCT’s water usage comes from cooling towers, toilets, washing activities and landscaping. In 2025, CLCT’s total water consumption was 632,236 m3. This translates to a water consumption intensity of 0.47 m3/m2, a 45.3% reduction compared to the 2019 baseline. On a YoY basis, CLCT’s water consumption intensity recorded a decrease of 9.6% due to several water efficiency measures implemented across the portfolio in FY 2025. At Rock Square, the replacement of legacy cooling towers with high-efficiency models significantly optimised makeup water usage. Additionally, at Grand Canyon, drainage optimisation was implemented for interior landscaping, effectively reducing unnecessary water consumption through improved system design.
As CLCT’s properties are mostly located in medium to extremely high-water stress areas19, we continue to implement the following initiatives in our retail and business parks to ensure efficient operations and minimise water wastage.
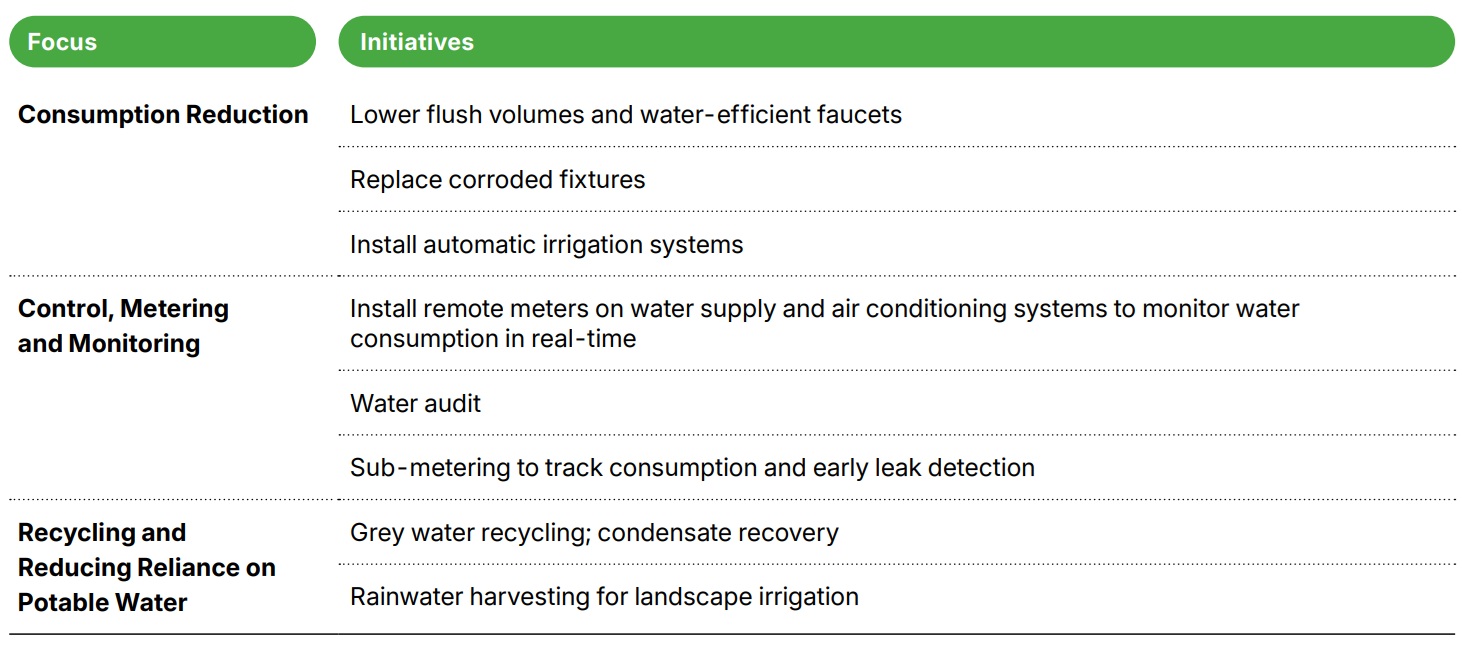
Our property managers conduct routine assessments of facilities to monitor water usage, promptly identifying and addressing any fluctuations or anomalies. CLCT organises quarterly operational meetings with tenants and employees to enhance water-saving awareness, reinforcing the significance of water conservation and sharing reduction measures with stakeholders.
Waste Management / Circularity
CLCT prioritises responsible waste management by engaging stakeholders, including tenants and the public, to reduce and recycle waste. Recycling and disposal bins for different waste types are strategically placed across properties for ease of use and to encourage recycling.
Main contractors are required to minimise waste and ensure proper disposal. Property management teams track waste collection and recycling efforts. CLCT also promotes eco-friendly practices, such as returning used toner cartridges and using Forest Stewardship Council (FSC)-certified paper. To further support sustainability, CLCT’s SR is made available online, eliminating the need for printing.
In 2025, CLCT collected a total of 7,115 tonnes of waste, of which 21.2% (equivalent to 1,505 tonnes) were recyclable waste comprising paper, plastic, metals and other materials. In line with local regulations, 0.8 tonnes of hazardous waste, comprising light bulbs and waste fire extinguishers, were generated and disposed of responsibly by third-party vendors.
17 This refers to gross greenhouse gas emissions. For more information on greenhouse gases covered by this target, please refer to the GHG Emissions Data Methodology.
18 This refers to net greenhouse gas emissions. For more information on greenhouse gases covered by the target, please refer to the GHG Emissions Data Methodology.
19 The water stress areas were computed using the World Resources Institute (WRI) Aqueduct Water Risk Atlas (wri.org).
Environmental Performance Highlights